Pavement tiling, Fes, Morocco

#mathart
3 posts3 participants0 posts today

 NEW BLOGPOST ALERT
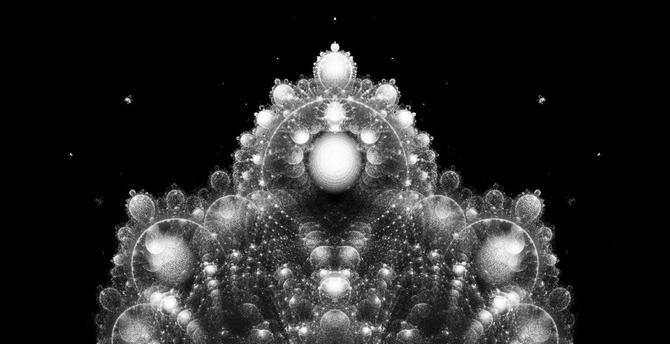

The twistor flow on real 3-space, induced by unit complex scalar multiplication on the 3-sphere, in a warm palette.
https://www.diffgeom.com/product/rolled-poster-twistor-sparks-warm/
https://www.diffgeom.com/product/canvas-twistor-sparks-warm/
Look at this brot!
start wiθ a cubic h oneycomb
split each cube into 6 pyramids
merge each pair ðat shares a 4gon into irregular octahedrons
& u get ðe almost regular octahedral h oneycomb
(yes, someone made ðis a technical term, rly)
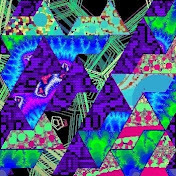
Pavement tiling, Ouarzazate, Morocco
#TilingTuesday #geometry #tiling #MathArt #photography #design #TravelPhotography #octagon
Continued thread
I added checkerboard tiling to my #complex #function #visualizer
Another visualization of Costa's original surface (torus with three punctures).
The parametrization is as attributed to Alfred Gray:
https://mathworld.wolfram.com/CostaMinimalSurface.html
The \(\wp\)-function is evaluated numerically using Wikipedia's expression in terms of \(\vartheta\)-functions, summing cosines over \(1 \leq n \leq 4\):
https://en.wikipedia.org/wiki/Theta_function#Jacobi_theta_function
https://en.wikipedia.org/wiki/Weierstrass_elliptic_function#Relation_to_Jacobi's_theta_functions
My code to evaluate complex line integrals is fairly simple-minded; line segments and parabolic sums ("Simpson's rule") with 16 pieces (subintervals) sufficed.
With these conventions, the unit square \([0, 1] + i[0, 1]\) is a fundamental domain. The points \(1/2\) and \(i/2\) are the catenoid ends; \((1+i)/2\) is the planar end. I split the domain into four squares of side length \(1/2\), three centered at the punctures, the fourth centered at \(0\). The colors correspond to these squares.
To parametrize these squares "nicely" I used the inverse elliptic function
\[
f(z) := \int_{0}^{z} \frac{dw}{\sqrt{1 + w^{4}}},
\]
which maps the unit disk conformally to a square with sides parallel to the coordinate axes. Scaling, translating, and precomposing with polar coordinates (for the center) or with the exponential map (to avoid the punctures), and a bit of ad hoc fiddling to shrink the disks (avoiding the singularities of the integrand/corners of the image of \(f\)), gives the image/animation shown.
|z|^4/(1 + z zz) + c #nietzschebrot
  = full anti-bbrot
 = sphere trap
 =
=  trap
trap

three linked trisections of a hexagon
large-scale woodblock print, steamroller assisted
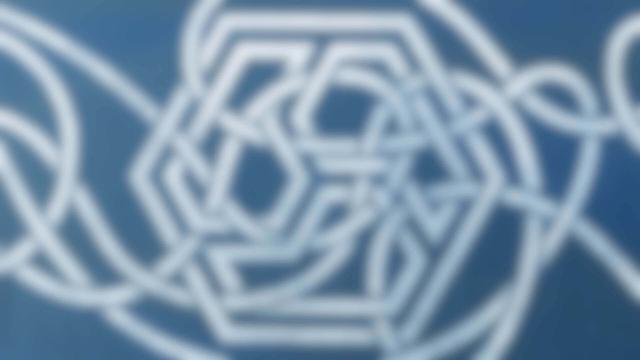
adam rowe · three linked trisections of a hexagonlarge-scale woodblock print, steamroller assisted
if u rly θink about it nihilism is just secularized judaism in decline 
(also yes, "nietzschebrot" is a real term now, because I am using it 𓅱)
#FractalFriday (It's already Saturday)
Elephant valley of the Mobius Mandelbrot set.
Formula: \(z_{n+1}=f(z_n^2+c,1)\)
where \(f(z, a)\) is defined as (C-like pseudocode):
Complex f(Complex z, Real a) {
Real dist = abs(re(z)) - a;
if (re(z) > a) {
re(z) = -a + dist;
im(z) = -im(z);
} else if (re(z) < -a) {
re(z) = a - dist;
im(z) = -im(z);
}
return z;
}
Coloring is done by using three very similar colormaps, mapped to triangle inequality average values.
The final color is produced by interpolating between these three colors using the so called "atom domains".
Generated using my GLSL Shadertoy fractal generator: https://www.shadertoy.com/view/33sSRf

Look at my new sketch on #openprocessing, ColourCurtain.
https://openprocessing.org/sketch/2695752
The items' colours are altered resulting from the counter value mod 3; thus, only one of the three colour channels is changed, causing the effect of an irregular colour gradient.
Try out generating more pattern by reloading the page.

New free pattern on Ravelry:
https://www.ravelry.com/patterns/library/pixie-square
The Pixie Square is a new type of crochet granny square designed for detailed, high-complexity, pixellated motifs. (Great for mathematical patterns!)
 - 太陽動物園
4d shapes
9d colors

"The Great Splash". Based on the golden ratio.
#fractal #mathart #algorithmicArt #GoldenRatio
Replied in thread
I reused the paper from Solar Crown (David Martinez) to make Estrella de Origami Mimi by Keila Correa, instructions in video by YoshiYoshi https://www.youtube.com/watch?v=QJlgJeHE_UI
A pleasing modular @origami model using only four folds for each unit.
The Nilgeometric Geodesic Cone in horizontal view
Continued thread
Solar Crown by David Martinez, taught by Caryn Lum at Greater San Diego @Origami Group Virtual Folding Fun https://origamiusa.org/calendar
Original video instructions https://www.instagram.com/p/DLaOcllu490